This Excel bar chart displays the demographics of a Business Analysis class. Approximately how many students are in the class? 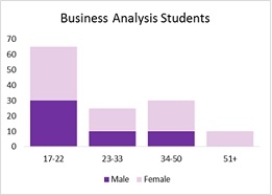
A) 15
B) 50
C) 105
D) 30
Correct Answer:
Verified
Q41: The total number of runs scored by
Q42: Growth is the primary focus for
Q43: Sadie is constructing a bar chart to
Q44: The regional manager of a company
Q45: A survey on the average pass
Q47: Natalie needs to compare the number of
Q48: The income levels vary by race and
Q49: The data on the distance walked
Q50: The following table shows the average
Q51: The project lead in an MNC decides
Unlock this Answer For Free Now!
View this answer and more for free by performing one of the following actions

Scan the QR code to install the App and get 2 free unlocks

Unlock quizzes for free by uploading documents