This bar chart displays the demographics of a Business Analysis class. How many males students are in the class? 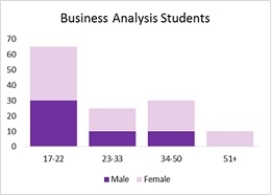
A) 15
B) 50
C) 75
D) 30
Correct Answer:
Verified
Q48: The income levels vary by race and
Q49: The data on the distance walked
Q50: The following table shows the average
Q51: The project lead in an MNC decides
Q52: The data on the ranks assigned
Q54: The owner of a grocery store
Q55: Consider the following data on 30
Q56: A local search service company surveys
Q57: Consider the following survey results regarding
Q58: A consumer electronics company, after three
Unlock this Answer For Free Now!
View this answer and more for free by performing one of the following actions

Scan the QR code to install the App and get 2 free unlocks

Unlock quizzes for free by uploading documents