Identify the shape of the distribution in the figure below. 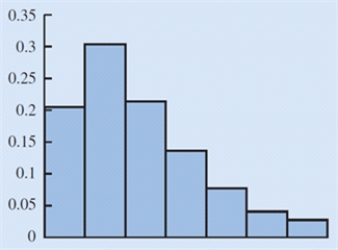
A) Moderately skewed left
B) Symmetric
C) Approximately Bell Shaped
D) Moderately skewed right
Correct Answer:
Verified
Q4: The difference in a variable measured over
Q5: When working with large spreadsheets with many
Q16: A summary of data that shows the
Q19: The act of collecting data that are
Q19: Which of the following gives the proportion
Q29: For data having a bell-shaped distribution, approximately
Q32: Compute the IQR for the following data.
Q35: The _ shows the number of data
Q36: Compute the third quartile for the following
Q37: Use technology to compute the standard deviation
Unlock this Answer For Free Now!
View this answer and more for free by performing one of the following actions

Scan the QR code to install the App and get 2 free unlocks

Unlock quizzes for free by uploading documents