Finish times (to the nearest hour) for 59 dogsled teams are shown below. Draw a histogram. Use five classes. The frequency table for the above data is given below.
A) 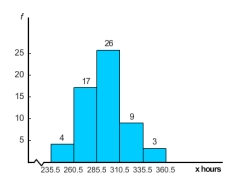
B) 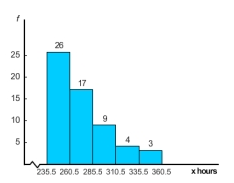
C) 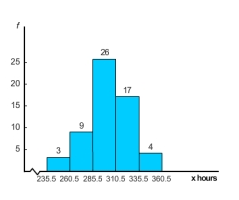
D) 
E) 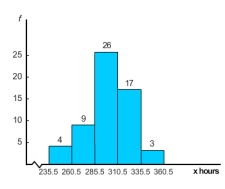
Correct Answer:
Verified
Q6: Finish times (to the nearest hour)
Q7: At Westgate Community College, a survey was
Q8: It's not an easy life, but it's
Q9: Wetlands offer a diversity of benefits.
Q10: Finish times (to the nearest hour)
Q12: How long did real cowboys live?
Q13: Assume that the following data represent
Q14: Assume that the following data represent
Q15: Finish times (to the nearest hour)
Q16: Finish times (to the nearest hour)
Unlock this Answer For Free Now!
View this answer and more for free by performing one of the following actions

Scan the QR code to install the App and get 2 free unlocks

Unlock quizzes for free by uploading documents