Use this graph to answer the question.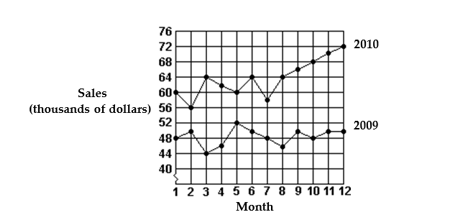
-What were the sales in month 8 of 2010?
A) $62,000
B) $66,000
C) $64,000
D) $50,000
Correct Answer:
Verified
Q78: The following test scores were recorded for
Q79: Frequency is represented by the height of
Q80: A good statistical indicator to avoid the
Q81: A small computing center has found that
Q82: The Wellspring Company's fleet of trucks get
Q84: The bar graph below shows the percent
Q85: The test scores of 40 students
Q86: The bar graph below shows the percent
Q87: Accountants often use the median when studying
Q88: Find the mode for the amounts:$1187, $14,356,
Unlock this Answer For Free Now!
View this answer and more for free by performing one of the following actions

Scan the QR code to install the App and get 2 free unlocks

Unlock quizzes for free by uploading documents