Figure: Random Allocation under Price Ceilings 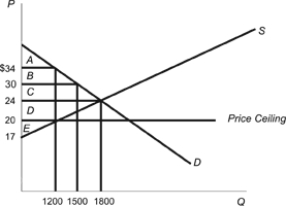
Refer to the figure. The government enacted a price ceiling of $6 per unit. Using the information provided in the graph, calculate the following:
a. If the goods are allocated randomly between the high-value uses and the low-value uses, what is the total amount of consumer surplus in dollars?
b. What is the lost amount of consumer surplus when goods are allocated randomly, when compared to a situation in which the goods are allocated only to the highest-value uses?
Correct Answer:
Verified
View Answer
Unlock this answer now
Get Access to more Verified Answers free of charge
Q281: If a price floor is below the
Q301: In the presence of a price floor,
Q302: Assume that a market is defined by
Q305: A market's demand and supply curves are
Q309: Minimum wage laws are an example of
Q313: Price floors and price ceilings both result
Q314: If the equilibrium wage is $10 an
Q317: A price floor makes it illegal for
Q318: Although a minimum wage increases unemployment, it
Q319: When the price of gasoline rose to
Unlock this Answer For Free Now!
View this answer and more for free by performing one of the following actions

Scan the QR code to install the App and get 2 free unlocks

Unlock quizzes for free by uploading documents