Figure: Demand-Driven Price Change 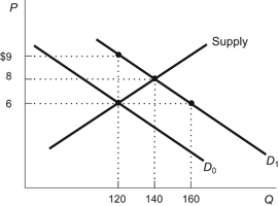 Refer to the figure. When the demand curve shifts from D0 to D1, the equilibrium price rises to:
A) $9 and the equilibrium quantity rises to 120.
B) $9 and the equilibrium quantity rises to 160.
C) $8 and the equilibrium quantity rises to 140.
D) $8 and the equilibrium quantity rises to 160.
Correct Answer:
Verified
Q103: Immediately after a hurricane, it is likely
Q105: Which of the following would NOT lead
Q117: Five new sellers enter a market (that
Q121: What effect do computer chip sellers' expectations
Q126: What will happen in the market for
Q130: If the demand increases, what happens with
Q133: Which of the following events will cause
Q135: What can cause both equilibrium price and
Q137: If supply decreases and its slope remains
Q140: An increase in demand causes a:
A) temporary
Unlock this Answer For Free Now!
View this answer and more for free by performing one of the following actions

Scan the QR code to install the App and get 2 free unlocks

Unlock quizzes for free by uploading documents