Figure: Supply-Driven Price Change 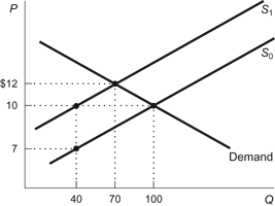 Refer to the figure. When the supply curve shifts from S0 to S1, the equilibrium price rises to:
A) $12 and the equilibrium quantity falls to 70.
B) $10 and the equilibrium quantity falls to 100.
C) $12 and the equilibrium quantity falls to 40.
D) $10 and the equilibrium quantity falls to 70.
Correct Answer:
Verified
Q81: Use the following to answer questions:
Figure: Market
Q88: The September 11 terrorist attacks turned many
Q102: Use the following to answer questions:
Figure: Demand,
Q115: If the government institutes a tax on
Q117: Five new sellers enter a market (that
Q121: What effect do computer chip sellers' expectations
Q129: How did the spread of the Internet
Q130: If the demand increases, what happens with
Q131: A(n) _ causes the equilibrium price to
Q137: If supply decreases and its slope remains
Unlock this Answer For Free Now!
View this answer and more for free by performing one of the following actions

Scan the QR code to install the App and get 2 free unlocks

Unlock quizzes for free by uploading documents