Figure: Supply and Demand 2 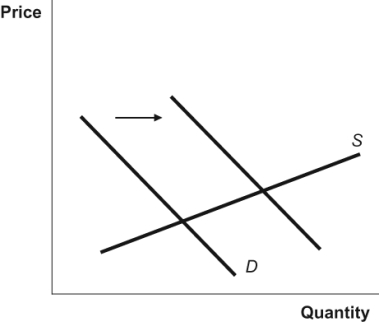 What happens as a result of the change in demand in the diagram?
A) a decrease in both the equilibrium price and the equilibrium quantity
B) an increase in both the equilibrium price and the equilibrium quantity
C) an increase in the equilibrium price and a decrease in the equilibrium quantity
D) a decrease in the equilibrium price and an increase in the equilibrium quantity
Correct Answer:
Verified
Q123: Imagine a free market in equilibrium. After
Q124: If demand decreases, ceteris paribus, market price
Q134: If supply decreases, ceteris paribus, market price
Q136: Imagine a free market in equilibrium. After
Q145: If demand decreases, ceteris paribus, the quantity
Q150: If market demand decreases:
A) equilibrium price and
Q156: Following the release of a new study
Q170: In the market for a normal good,
Q174: A technological innovation in the production of
Q177: An increase in the quantity supplied results
Unlock this Answer For Free Now!
View this answer and more for free by performing one of the following actions

Scan the QR code to install the App and get 2 free unlocks

Unlock quizzes for free by uploading documents