Figure: Demand Shift 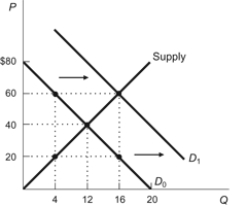 In the figure, the demand curve shifted from D0 to D1. To describe this movement, we would say that:
A) demand increased, which caused an increase in supply.
B) quantity demanded increased, which caused an increase in supply.
C) demand increased, which caused an increase in quantity supplied.
D) quantity demanded increased, which caused an increase in quantity supplied.
Correct Answer:
Verified
Q141: When you move along a demand curve:
A)
Q161: What is the difference between a change
Q167: What effect did the 1997 East Asian
Q168: What is the difference between a shift
Q172: The Arab Oil Embargo of 1973, the
Q175: When Asian countries went into a recession
Q177: Figure: Supply and Demand 3 
Q182: A market surplus can be defined as
Q184: Figure: Four Panel 3 Q196: The United Nations estimates that Earth's population![]()
Unlock this Answer For Free Now!
View this answer and more for free by performing one of the following actions

Scan the QR code to install the App and get 2 free unlocks

Unlock quizzes for free by uploading documents