Multiple Choice
Figure: Religion 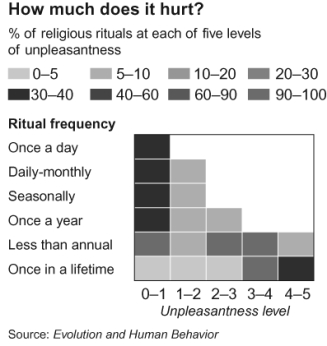 This graph illustrates the work of psychologists Harvey Whitehouse and Quentin Atkinson, as published in the April 23-29, 2011 issue of The Economist. The "unpleasantness" of religious rituals (0 is low, 5 is high) is along the x-axis. How often the religion requires the ritual to be performed is along the y-axis. What economic concept does this diagram represent?
A) opportunity cost
B) consumer surplus
C) a demand curve
D) an inferior good
Correct Answer:
Verified
Related Questions
Q1: Use the following to answer questions:
Figure: Good
Q2: The quantity demanded is the quantity that
Q7: The law of demand states that:
A) the

