Figure: Demand Shift 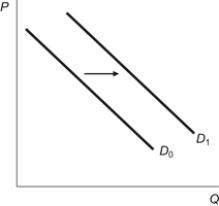 Which of the following could explain the figure?
A) Consumer income increases in the market for a normal good.
B) Consumer income falls in the market for a normal good.
C) Consumer income rises in the market for an inferior good.
D) Consumer income remains the same and the price of the good falls.
Correct Answer:
Verified
Q61: An inferior good is one that:
A) is
Q62: Zoey receives a big raise at work
Q65: A good is considered normal if demand
Q66: The average age in the United States
Q69: Mario buys eight units of good X
Q76: Coke and Pepsi are substitute soft drinks.
Q80: For a normal good, higher income results
Q81: Figure: Demand Shift Q89: A local university decides to double its Q93: If the price of shotguns _, the![]()
Unlock this Answer For Free Now!
View this answer and more for free by performing one of the following actions

Scan the QR code to install the App and get 2 free unlocks

Unlock quizzes for free by uploading documents