Use the following to answer questions: Figure: Oil Market Diagrams 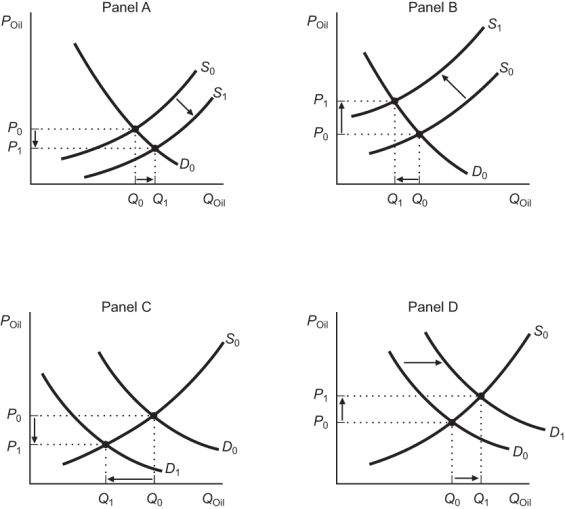
-(Figure: Oil Market Diagrams) Consider the world oil market diagrams presented in the figure. Which of the panels correctly depicts the cause of rises in the price of oil in the early 2000s?
A) Panel A
B) Panel B
C) Panel C
D) Panel D
Correct Answer:
Verified
Q117: An economy can overcome a large negative
Q118: A hurricane that damages buildings and roadways
Q119: A negative shock to the long-run aggregate
Q120: How has the role of agricultural production
Q121: What type of shock could be responsible
Q123: Which of the following is an example
Q124: Figure: Real Shocks Q125: High oil prices tend to: Q126: The first oil shock to have a Q127: Figure: Real Output Shock ![]()
A) increase the![]()
Unlock this Answer For Free Now!
View this answer and more for free by performing one of the following actions

Scan the QR code to install the App and get 2 free unlocks

Unlock quizzes for free by uploading documents