Figure: Allocating Goods under Price Ceilings 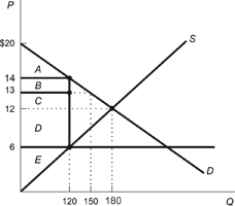
Refer to the figure. Using the information provided in the graph, answer the following questions:
a. If the goods were allocated only to those users who had the highest-value uses, find the total dollar amount of consumer surplus.
b. If the goods are allocated randomly between the high-value uses and the low-value uses, then what is the average value of the good?
c. If goods are allocated randomly, what is the total dollar amount of consumer surplus?
Correct Answer:
Verified
View Answer
Unlock this answer now
Get Access to more Verified Answers free of charge
Q303: Rent controls are typically implemented as a
Q307: Using a supply and demand diagram as
Q308: Illustrate on a supply and demand diagram
Q310: Briefly discuss the U.S. experience with price
Q319: When the price of gasoline rose to
Q320: A minimum wage mostly creates unemployment among
Q321: Do shortages caused by rent controls tend
Q322: Graphically illustrate supply and demand in a
Q325: The demand and supply of labor are
Q327: Rent controls have five important effects on
Unlock this Answer For Free Now!
View this answer and more for free by performing one of the following actions

Scan the QR code to install the App and get 2 free unlocks

Unlock quizzes for free by uploading documents