Figure: Random Allocation under Price Ceilings 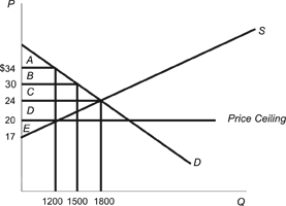
Refer to the figure. The government enacted a price ceiling of $6 per unit. Using the information provided in the graph, calculate the following:
a. If the goods are allocated randomly between the high-value uses and the low-value uses, what is the total amount of consumer surplus in dollars?
b. What is the lost amount of consumer surplus when goods are allocated randomly, when compared to a situation in which the goods are allocated only to the highest-value uses?
Correct Answer:
Verified
View Answer
Unlock this answer now
Get Access to more Verified Answers free of charge
Q297: Housing shortages caused by rent controls are
Q298: The Soviet Union's experience with price controls
Q299: Rent controls create large shortages in the
Q301: In the presence of a price floor,
Q305: A market's demand and supply curves are
Q306: The minimum wage is an example of
Q309: Minimum wage laws are an example of
Q311: The Civil Aeronautics Board regulated airline fares
Q312: Many times after natural disasters such as
Q316: Regulation of entry in the airline industry
Unlock this Answer For Free Now!
View this answer and more for free by performing one of the following actions

Scan the QR code to install the App and get 2 free unlocks

Unlock quizzes for free by uploading documents