Multiple Choice
Figure: Demand 1 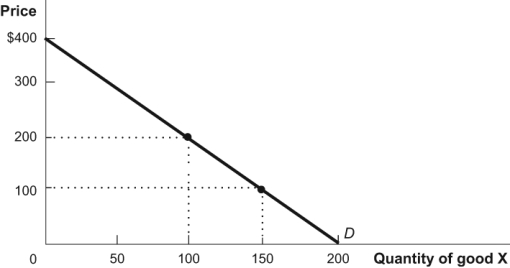 In the diagram, what is the elasticity of demand between a price of $100 and $200? Use the midpoint method of calculation to find your answer.
A) -1.8.
B) -0.9.
C) -0.6.
D) -0.2.
Correct Answer:
Verified
Related Questions
Q81: If the demand for heroin is inelastic
Q82: When demand is _, an increase in
Q85: Suppose the price of a good rises
Q87: The elasticity of demand is always negative
Q93: Use the midpoint method to answer this
Unlock this Answer For Free Now!
View this answer and more for free by performing one of the following actions

Scan the QR code to install the App and get 2 free unlocks

Unlock quizzes for free by uploading documents