Figure: Supply and Demand 1 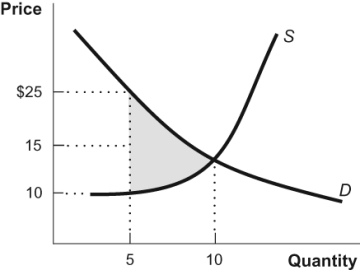 At a market quantity of 5, the shaded region in the figure represents:
A) satisfied wants.
B) unexploited gains from trade.
C) the value of wasted resources.
D) willingness to pay.
Correct Answer:
Verified
Q64: When producers produce more than the equilibrium
Q70: Gains from trade will be maximized at
Q72: When the price of a good equals
Q77: Use the following to answer questions:
Figure: Price
Q81: Use the following to answer questions:
Figure: Market
Q83: Use the following to answer questions:
Figure: Market
Q83: An early frost in the vineyards of
Q91: Brazilian rosewood is renowned for its tonal
Q92: Vernon Smith tested the supply and demand
Q110: Use the following to answer questions:
Figure: Demand,
Unlock this Answer For Free Now!
View this answer and more for free by performing one of the following actions

Scan the QR code to install the App and get 2 free unlocks

Unlock quizzes for free by uploading documents