Figure: Supply Shift 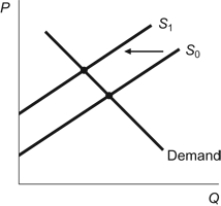 In the figure, the supply curve shifted from S0 to S1. To describe this movement, we would say that:
A) demand decreased, which caused a decrease in supply.
B) supply decreased, which caused a decrease in quantity demanded.
C) supply decreased, which caused a decrease in demand.
D) supply increased, which caused a decrease in quantity demanded.
Correct Answer:
Verified
Q141: When you move along a demand curve:
A)
Q151: Higher gasoline prices have led to a
Q153: After a hurricane in Florida destroys half
Q155: When demand increases there is a _
Q158: A demand curve shows the relationship between:
A)
Q161: What is the difference between a change
Q164: Figure: Four Panel 2 Q165: Figure: Four Panel 1 Q170: Figure: Demand Shift Q177: An increase in the quantity supplied results Unlock this Answer For Free Now! View this answer and more for free by performing one of the following actions Scan the QR code to install the App and get 2 free unlocks Unlock quizzes for free by uploading documents![]()
![]()
![]()

