Figure: Demand Shift 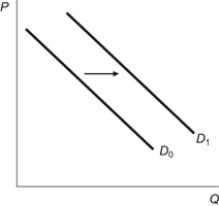 Which of the following could explain the figure?
A) Consumer income increases in the market for a normal good.
B) Consumer income falls in the market for a normal good.
C) Consumer income rises in the market for an inferior good.
D) Consumer income remains the same and the price of the good falls.
Correct Answer:
Verified
Q30: When you are willing to pay $5
Q49: Alex and Tyler enjoy the food at
Q53: Which one of the following choices would
Q55: To economists, the term consumer surplus means:
A)
Q61: An inferior good is one that:
A) is
Q66: The average age in the United States
Q73: The quantity of DVDs that people plan
Q75: Michael graduates from college and his income
Q77: As the population of elderly in the
Q80: For a normal good, higher income results
Unlock this Answer For Free Now!
View this answer and more for free by performing one of the following actions

Scan the QR code to install the App and get 2 free unlocks

Unlock quizzes for free by uploading documents