Multiple Choice
Figure: Chicken Legs 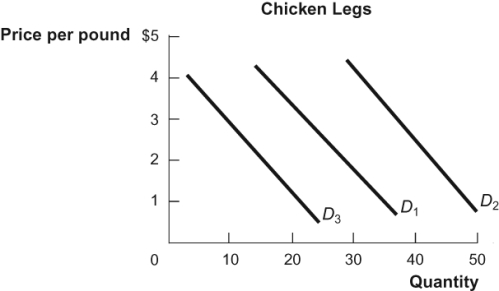 In the diagram, the current demand curve for chicken legs is represented by D1. If the price of chicken thighs, a substitute for chicken legs, decreases, the demand curve for chicken legs will:
A) shift to D2.
B) shift to D3.
C) remain at D1.
D) shift to D2 and then back to D1.
Correct Answer:
Verified
Related Questions
Q81: As world coal prices rise due to
Q82: Which of the following would cause the
Q86: Figure: Demand Shift Q86: Peoples' expectation of the price of gasoline Q88: A decrease in the price of one![]()
Unlock this Answer For Free Now!
View this answer and more for free by performing one of the following actions

Scan the QR code to install the App and get 2 free unlocks

Unlock quizzes for free by uploading documents