Figure: Supply Shift 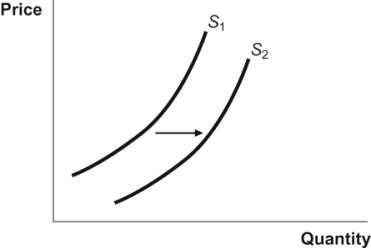 In the figure, a movement from S1 to S2 represents:
A) a decrease in supply.
B) an increase in supply.
C) a decrease in quantity supplied.
D) an increase in quantity supplied.
Correct Answer:
Verified
Q122: The difference between the market price and
Q142: Use the following to answer questions:
Figure: Producer
Q143: Use the following to answer questions:
Q148: In the oil market, an increase in
Q151: Suppose that Saudi Arabia can produce oil
Q154: Producer surplus is:
A) the difference between the
Q156: Use the following to answer questions:
Q157: Use the following to answer questions:
Figure: Producer
Q158: Total producer surplus equals:
A) the supply curve.
B)
Q158: Figure: A Supply Curve ![]()
Unlock this Answer For Free Now!
View this answer and more for free by performing one of the following actions

Scan the QR code to install the App and get 2 free unlocks

Unlock quizzes for free by uploading documents