Multiple Choice
Figure: Leisure 2 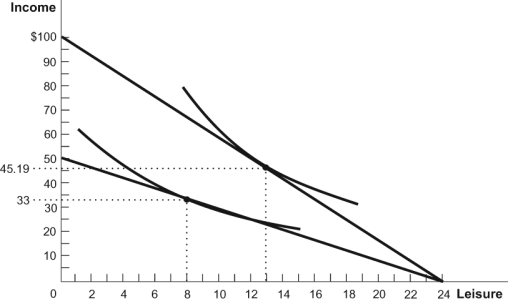 Refer to the figure. According to this diagram, which statement is FALSE?
A) At 13 hours of leisure and an income of $45.19, the worker earns a wage of $4.17 an hour.
B) The labor supply curve is downward sloping.
C) The substitution effect dominates the income effect.
D) This worker chooses to work more hours if paid higher wages.
Correct Answer:
Verified
Related Questions
Q81: Use the following to answer questions:
Figure: Income
Q84: Suppose that Barry's wage increases and he
Q86: Barry's wage increased and he responded by

