Figure: Market for Plumbers 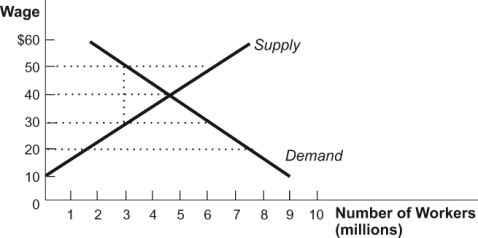 If the market in this figure is in equilibrium, the hourly wage paid to plumbers is ______ and the marginal product of a plumber is ______.
A) $40; $20
B) $30; $50
C) $40; $40
D) $20; $30
Correct Answer:
Verified
Q26: When labor demand increases, the wage is
Q28: The individual supply curve for labor:
A) slopes
Q29: If the marginal product of labor is
Q31: Which of the following best explains why
Q37: When labor demand decreases, the wage is
Q40: If the marginal product of labor is
Q43: It is possible for an individual to
Q48: When labor supply increases, the wage is
Q52: A high demand for labor in one
Q59: A single person's supply curve for labor
Unlock this Answer For Free Now!
View this answer and more for free by performing one of the following actions

Scan the QR code to install the App and get 2 free unlocks

Unlock quizzes for free by uploading documents