Exhibit 12-6 Lorenz curves 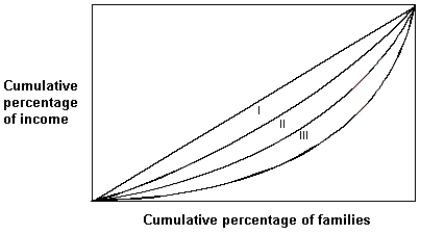
-Exhibit 12-6 shows the Lorenz Curve for three countries, I, II, and III. Of the three countries shown,
A) Country III has the most unequal income distribution.
B) Country II has the most unequal income distribution.
C) Country I has the most unequal income distribution.
D) Country III has the most equal income distribution.
E) Country II has a more equal income distribution than Country I.
Correct Answer:
Verified
Q3: Which of the following correctly describes the
Q17: The Lorenz curve shows the:
A) growth of
Q18: In the United States, approximately what percentage
Q20: The poorest 20 percent of the U.S.
Q21: Exhibit 12-4 Lorenz curve Q23: After 1929 in the United States, as Q24: Between 1929 and 2005 in the United Q25: Exhibit 12-2 Lorenz curve Q26: Between 1929 and 2005 in the United Q27: Exhibit 12-4 Lorenz curve Unlock this Answer For Free Now! View this answer and more for free by performing one of the following actions Scan the QR code to install the App and get 2 free unlocks Unlock quizzes for free by uploading documents![]()
![]()
![]()

