Exhibit 11-4 Supply and demand curves for food servers 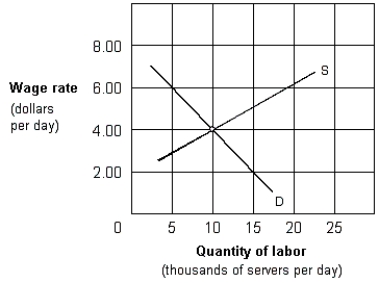
-In Exhibit 11-4, the equilibrium wage and the number of food servers employed per day, respectively, are:
A) $2.00 and 5,000.
B) $4.00 and 10,000.
C) $6.00 and 15,000
D) $8.00 and 20,000.
Correct Answer:
Verified
Q70: If more and better technology is used
Q71: If the marginal product of labor is
Q72: The optimal number of workers to be
Q73: Exhibit 11-4 Supply and demand curves for
Q76: Which of the following determines equilibrium wages
Q77: Exhibit 11- 7 Demand for labor curves
Q78: According to the economic theory of labor
Q78: Exhibit 11-5 Sally's labor supply data
Q79: Exhibit 11-4 Supply and demand curves for
Q80: Exhibit 11-4 Supply and demand curves for
Unlock this Answer For Free Now!
View this answer and more for free by performing one of the following actions

Scan the QR code to install the App and get 2 free unlocks

Unlock quizzes for free by uploading documents