Exhibit 8-2 Total revenue and total cost graph 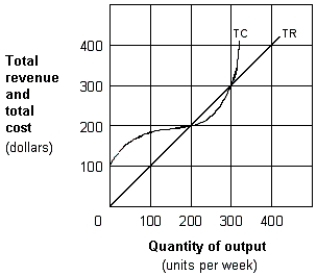
-In Exhibit 8-2, economic profit for the firm is at a maximum when output per week equals:
A) zero units.
B) 100 units.
C) 200 units.
D) 250 units.
E) 300 units.
Correct Answer:
Verified
Q89: Above the shutdown point, a competitive firm's
Q93: If a competitive firm is losing money
Q110: A perfectly competitive firm's short-run supply curve
Q111: Exhibit 8-4 Marginal cost and revenue
Q112: Exhibit 8-4 Marginal cost and revenue
Q115: Exhibit 8-3 Cost per unit curves
Q116: Exhibit 8-3 Cost per unit curves
Q117: Exhibit 8-3 Cost per unit curves
Q118: Exhibit 8-4 Marginal cost and revenue
Q119: Exhibit 8-3 Cost per unit curves
Unlock this Answer For Free Now!
View this answer and more for free by performing one of the following actions

Scan the QR code to install the App and get 2 free unlocks

Unlock quizzes for free by uploading documents