Exhibit 8-12 Marginal revenue and cost per unit curves 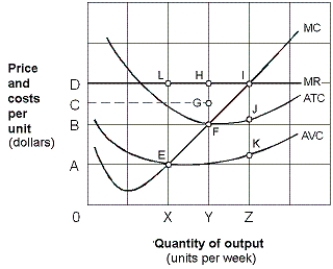
-As shown in Exhibit 8-12, if the price is OB, the firm's total cost of producing at its most profitable level of output is:
A) YF.
B) XL.
C) OYFB.
D) OXEA.
Correct Answer:
Verified
Q144: Exhibit 8-15 Short-run cost curves for E-Z
Q145: Exhibit 8-16 Short-run cost curves for a
Q146: Exhibit 8-16 Short-run cost curves for a
Q147: Exhibit 8-15 Short-run cost curves for E-Z
Q148: Exhibit 8-12 Marginal revenue and cost per
Q150: Exhibit 8-15 Short-run cost curves for E-Z
Q151: Exhibit 8-14 Total cost and total revenue
Q152: Exhibit 8-12 Marginal revenue and cost per
Q153: Exhibit 8-13 Price and cost per unit
Q154: Exhibit 8-14 Total cost and total revenue
Unlock this Answer For Free Now!
View this answer and more for free by performing one of the following actions

Scan the QR code to install the App and get 2 free unlocks

Unlock quizzes for free by uploading documents