Exhibit 7-13 Cost curves 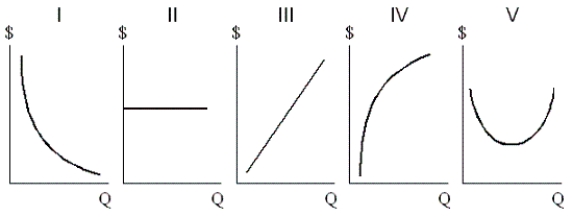
-In Exhibit 7-13, AFC is shown by the graph labeled:
A) I.
B) II.
C) III.
D) IV.
E) V.
Correct Answer:
Verified
Q92: If total cost is $1,000 when output
Q161: Each potential short-run average total cost curve
Q162: Which of the following best describes marginal
Q163: In the long run, total fixed cost
Q164: Which of the following statements is true?
A)
Q165: If the minimum points of all the
Q167: Exhibit 7-12 Cost schedule for producing
Q168: When the curve that envelops the series
Q170: Exhibit 7-13 Cost curves Q171: Exhibit 7-12 Cost schedule for producing![]()
Unlock this Answer For Free Now!
View this answer and more for free by performing one of the following actions

Scan the QR code to install the App and get 2 free unlocks

Unlock quizzes for free by uploading documents