Exhibit 5-9 Supply and demand curves for good X
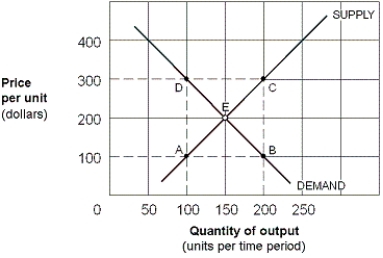
-As shown in Exhibit 5-9, assuming good X is a normal good, an increase in consumer income, other factors held constant, could move the equilibrium from point E to point:
A) A.
B) B.
C) C.
D) D.
Correct Answer:
Verified
Q129: Using supply and demand analysis, which of
Q182: If the federal government placed a 50
Q184: An excise tax levied on a product
Q199: If the government wants to raise tax
Q223: Exhibit 5-8 Supply and demand curves for
Q225: Exhibit 5-8 Supply and demand curves for
Q228: Exhibit 5-9 Supply and demand curves for
Q229: Exhibit 5-9 Supply and demand curves for
Q231: Exhibit 5-8 Supply and demand curves for
Q232: Exhibit 5-9 Supply and demand curves for
Unlock this Answer For Free Now!
View this answer and more for free by performing one of the following actions

Scan the QR code to install the App and get 2 free unlocks

Unlock quizzes for free by uploading documents