Exhibit 4-3 Supply and demand curves 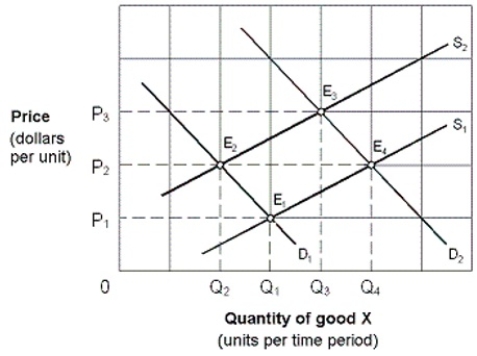
-Initially the market shown in Exhibit 4-3 is in equilibrium at P2, Q2 (E2) . Changes in market conditions result in a new equilibrium at P2, Q4 (E4) . This change is stated as a(n) :
A) increase in supply and an increase in demand.
B) increase in supply and a decrease in demand.
C) decrease in demand and a decrease in supply.
D) increase in demand with supply held constant at S2.
Correct Answer:
Verified
Q19: How would a decrease in consumer income
Q20: An increased equilibrium price and a decreased
Q21: Exhibit 4-2 Supply and demand curves
Q22: Exhibit 4-2 Supply and demand curves
Q24: Exhibit 4-2 Supply and demand curves
Q25: A hurricane destroyed the peach crop in
Q26: Which of the following would decrease the
Q27: Exhibit 4-2 Supply and demand curves
Q28: Exhibit 4-2 Supply and demand curves
Q194: How would a decrease in the price
Unlock this Answer For Free Now!
View this answer and more for free by performing one of the following actions

Scan the QR code to install the App and get 2 free unlocks

Unlock quizzes for free by uploading documents