Exhibit 4-3 Supply and demand curves 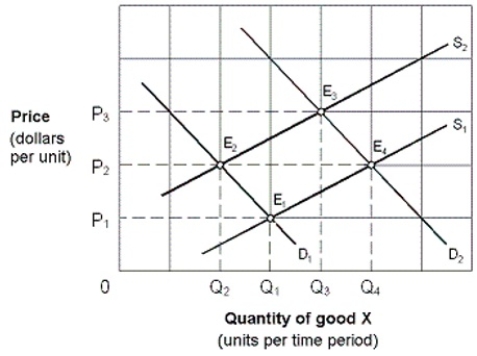
-The market shown in Exhibit 4-3 is initially in equilibrium at E4. Changes in market conditions result in a new equilibrium at E3. This change is stated as a(n) :
A) increase in supply and an increase in quantity demanded.
B) increase in supply and a decrease in demand.
C) decrease in supply and a decrease in quantity demanded.
D) increase in demand an increase in supply.
Correct Answer:
Verified
Q33: Consider the market for chicken. Assuming that
Q45: Exhibit 4-4 Supply and demand curves for
Q47: Exhibit 4-4 Supply and demand curves for
Q48: Exhibit 4-3 Supply and demand curves
Q49: Exhibit 4-3 Supply and demand curves
Q51: Exhibit 4-3 Supply and demand curves
Q52: Exhibit 4-3 Supply and demand curves
Q54: A decrease in buyers' income, assuming good
Q55: If the cost of fertilizer rises, then
Q169: Which of the following is the best
Unlock this Answer For Free Now!
View this answer and more for free by performing one of the following actions

Scan the QR code to install the App and get 2 free unlocks

Unlock quizzes for free by uploading documents