Exhibit 4-4 Supply and demand curves for good X 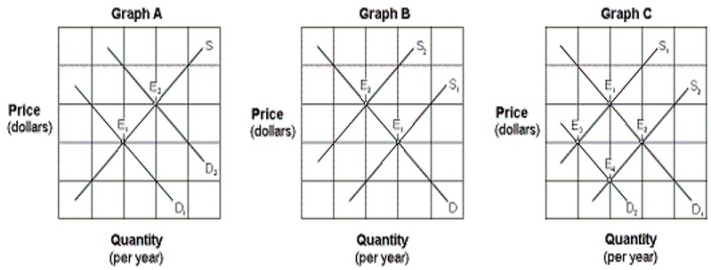
-Which of the graphs in Exhibit 4-4 illustrates an increase in buyers' income, assuming that good X is a normal good?
A) Graph A.
B) Graph B.
C) Graph C.
D) None of these.
Correct Answer:
Verified
Q55: If the cost of fertilizer rises, then
Q56: Which of the following statements is true
Q57: Exhibit 4-3 Supply and demand curves
Q58: Exhibit 4-4 Supply and demand curves for
Q59: Exhibit 4-3 Supply and demand curves
Q61: If consumers switch away from eating margarine
Q62: Exhibit 4-8 Demand and supply curves
Q63: Exhibit 4-8 Demand and supply curves
Q64: An increase in both supply and demand
Q65: Exhibit 4-6 Demand and supply curves
Unlock this Answer For Free Now!
View this answer and more for free by performing one of the following actions

Scan the QR code to install the App and get 2 free unlocks

Unlock quizzes for free by uploading documents