Exhibit 4-4 Supply and demand curves for good X 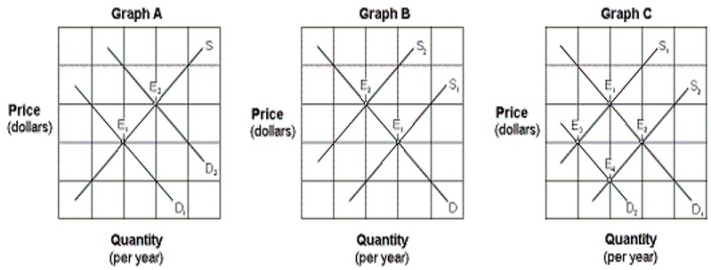
-An increase in the wage rate paid to workers producing good X would be represented by which of the graphs in Exhibit 4-4?
A) Graph A.
B) Graph B.
C) Graph C.
D) None of these.
Correct Answer:
Verified
Q21: Suppose prices for new homes have risen,
Q29: Which of the following would raise both
Q38: An increase in the price of plastic
Q39: A decrease in consumer income decreases the
Q40: If Congress decides to reduce the tax
Q43: Exhibit 4-5 Supply and demand curves for
Q45: Exhibit 4-4 Supply and demand curves for
Q47: Exhibit 4-4 Supply and demand curves for
Q169: Which of the following is the best
Q175: Consider the market for grapes. An increase
Unlock this Answer For Free Now!
View this answer and more for free by performing one of the following actions

Scan the QR code to install the App and get 2 free unlocks

Unlock quizzes for free by uploading documents