Exhibit 4-8 Demand and supply curves
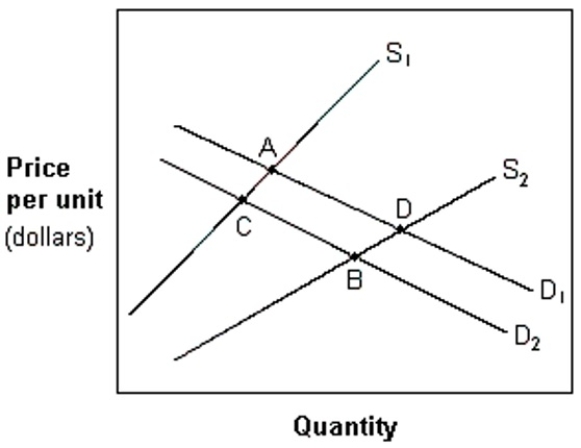
-In Exhibit 4-8, a movement from A to C is best described as a(n) :
A) increase in the quantity supplied and an increase in the demand.
B) decrease in the quantity supplied and a decrease in demand.
C) decrease in the quantity supplied and an increase in demand.
D) decrease in the quantity demanded and a decrease in supply.
E) decrease in both quantity demanded and quantity supplied.
Correct Answer:
Verified
Q73: If the market supply increases and, simultaneously,
Q74: Ceteris paribus, an increase in the supply
Q75: An increase in demand and a decrease
Q76: If market supply decreases and, simultaneously, market
Q77: A price ceiling that sets the price
Q79: Exhibit 4-8 Demand and supply curves
Q80: Exhibit 4-7 Demand and supply schedules
Q81: An example of a price ceiling would
Q82: Suppose a price ceiling is set by
Q83: If the equilibrium price of bread is
Unlock this Answer For Free Now!
View this answer and more for free by performing one of the following actions

Scan the QR code to install the App and get 2 free unlocks

Unlock quizzes for free by uploading documents