Exhibit 3-3 Demand curves 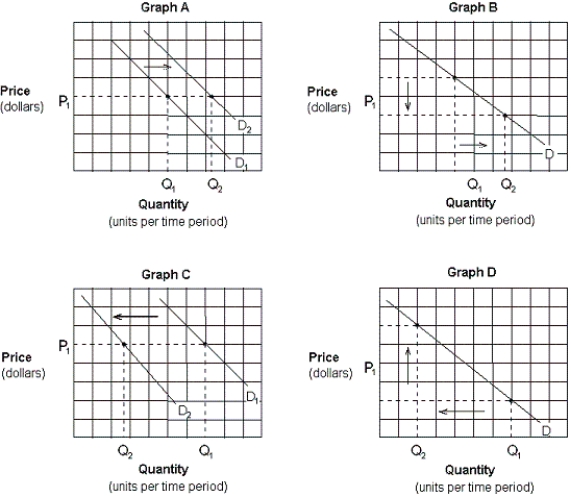
-Which of the graphs in Exhibit 3-3 depicts the effect of an increase in income on the demand for DVDs (a normal good) ?
A) Graph A.
B) Graph B.
C) Graph C.
D) Graph D.
Correct Answer:
Verified
Q67: Supply curves slope upward because:
A) the quality
Q77: The law of supply states that:
A) there
Q156: If two goods are complementary, a(n):
A) decrease
Q157: Two goods that are complementary are:
A) wrapping
Q158: Which of the following would most likely
Q159: If the price of hot dogs increases,
Q160: Sugar and honey are viewed as substitutes
Q162: Exhibit 3-3 Demand curves Q163: A supply schedule shows the relationship between: Q281: According to the law of supply,![]()
A)
A) producers
Unlock this Answer For Free Now!
View this answer and more for free by performing one of the following actions

Scan the QR code to install the App and get 2 free unlocks

Unlock quizzes for free by uploading documents