Exhibit 3-11 Demand and supply curves 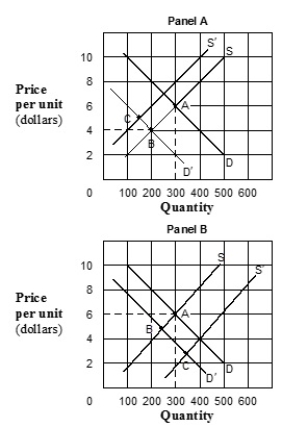
-In Exhibit 3-11, in Panel A the movement from A to C describes a (an) :
A) ambiguous change in price and a decrease in quantity.
B) increase in price and an ambiguous change in quantity.
C) increase in both price and quantity.
D) decrease in both price and quantity.
E) change in supply that dominates a change in demand.
Correct Answer:
Verified
Q282: Exhibit 3-15 Supply and demand curves for
Q283: Exhibit 3-14 Supply and demand curves
Q284: Exhibit 3-16 Supply and demand curves
Q285: Exhibit 3-12 Supply and demand data
Q286: Exhibit 3-15 Supply and demand curves for
Q288: Exhibit 3-13 Supply and demand curves
Q289: Exhibit 3-12 Supply and demand data
Q290: Exhibit 3-12 Supply and demand data
Q291: Exhibit 3-11 Demand and supply curves
Q292: Exhibit 3-15 Supply and demand curves for
Unlock this Answer For Free Now!
View this answer and more for free by performing one of the following actions

Scan the QR code to install the App and get 2 free unlocks

Unlock quizzes for free by uploading documents