Exhibit 3A-2 Comparison of Market Efficiency and Deadweight Loss 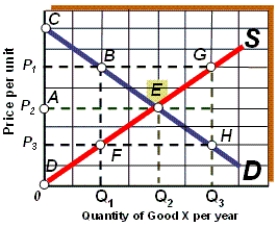
-As shown in Exhibit 3A-2, if the quantity supplied of good X per year is Q1, the result is a deadweight loss represented by area:
A) BEG.
B) CBEFD.
C) EGH.
D) BEF.
Correct Answer:
Verified
Q46: Suppose Jones sells a good for $100
Q47: Total surplus equals:
A) consumer surplus + producer
Q53: Suppose seller X is willing to sell
Q57: Suppose Alice sells a good for $60
Q376: Which of the following is not true
Q382: Exhibit 3A-1 Comparison of Market Efficiency and
Q383: Exhibit 3A-2 Comparison of Market Efficiency and
Q384: Exhibit 3A-1 Comparison of Market Efficiency and
Q385: Exhibit 3A-1 Comparison of Market Efficiency and
Q386: Exhibit 3A-2 Comparison of Market Efficiency and
Unlock this Answer For Free Now!
View this answer and more for free by performing one of the following actions

Scan the QR code to install the App and get 2 free unlocks

Unlock quizzes for free by uploading documents