Exhibit 2-5 Production possibilities curve 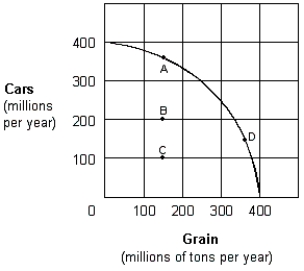
-In Exhibit 2-5, movement between which of the following points represents an increase in economic efficiency?
A) A to C.
B) C to D.
C) D to B.
D) A to B.
E) A to D.
Correct Answer:
Verified
Q59: Which of the following would be most
Q62: The law of increasing opportunity costs causes
Q86: Given a production possibilities curve, a point:
A)
Q87: Any point inside the production possibility curve
Q88: Exhibit 2-4 Production possibilities curve data
Q92: A point outside a production possibilities curve
Q93: Which of the following is true about
Q94: Which of the following is not true
Q95: A point inside a production possibilities curve
Q96: Along a production possibilities curve showing capital
Unlock this Answer For Free Now!
View this answer and more for free by performing one of the following actions

Scan the QR code to install the App and get 2 free unlocks

Unlock quizzes for free by uploading documents