Exhibit 2-18 Production possibilities curves 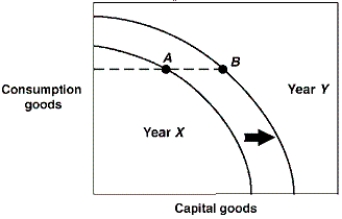
-In Exhibit 2-18, the production possibilities curves for a country are shown for the years Year X and Year Y. Suppose this country was located at point A in Year X and point B in Year Y. This economy:
A) is worse off in Year Y than in Year X.
B) has stagnated production in this two year period.
C) is more efficient in Year Y than in Year X.
D) has shown growth between these two years.
E) has higher unemployment in Year Y than in Year X.
Correct Answer:
Verified
Q105: A nation can accelerate its economic growth
Q170: Exhibit 2-18 Production possibilities curves 
Q171: The opportunity cost of attending a movie
Q172: Which of the following statements is false?
A)
Q173: Only socialist economies need to answer the
Q174: The process of accumulating capital is called:
A)
Q176: When making a rational decision which requires
Q177: Exhibit 2-19 Production possibilities curves
Q178: Exhibit 2-18 Production possibilities curves
Q179: An opportunity cost is the highest valued
Unlock this Answer For Free Now!
View this answer and more for free by performing one of the following actions

Scan the QR code to install the App and get 2 free unlocks

Unlock quizzes for free by uploading documents