Using the graph below draw a marginal cost curve that would likely be the result. Use the output level of 200 as a reference point and explain why you drew it the way you did. 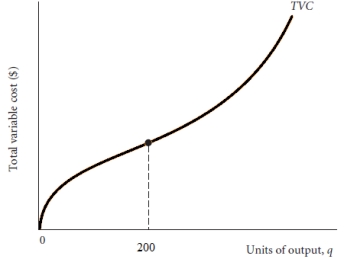
Correct Answer:
Verified
View Answer
Unlock this answer now
Get Access to more Verified Answers free of charge
Q23: The equation for the firm's total variable
Q24: Prove that the total cost curve and
Q25: What is the relationship between marginal cost
Q26: What is the relationship between total variable
Q27: What two things does the level of
Q29: How is average variable cost calculated? If
Q30: Suppose that a firm has an average
Q31: Why does marginal cost eventually rise as
Q32: Patty's Pizza Palace faces the following hourly
Q33: Draw two graphs. In the first graph
Unlock this Answer For Free Now!
View this answer and more for free by performing one of the following actions

Scan the QR code to install the App and get 2 free unlocks

Unlock quizzes for free by uploading documents