The figures below represent the demand for a public good for two consumers, Tom and Jerry. Assuming that these are the only two buyers, draw a graph showing the market demand curve for this public good. 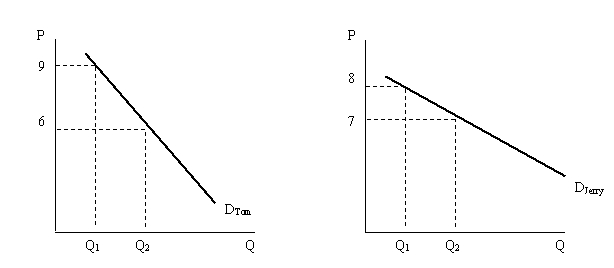
Correct Answer:
Verified
View Answer
Unlock this answer now
Get Access to more Verified Answers free of charge
Q42: What is the free-rider problem?
Q43: How is the market demand for public
Q44: What is the drop-in-the-bucket problem?
Q45: What is the optimal level of provision
Q46: Some states require that unions represent non-union
Q48: Explain why cable television is not a
Q49: Explain why a freeway isn't always considered
Q50: Give an example of a public good.
Q51: What does it mean for a good
Q52: What does it mean for a good
Unlock this Answer For Free Now!
View this answer and more for free by performing one of the following actions

Scan the QR code to install the App and get 2 free unlocks

Unlock quizzes for free by uploading documents