Please refer to the nearby figure. In the market for asparagus, consumer income rises by 10%, leading to the new demand curve: QD = -0.5P + 6.5. What is the income elasticity of demand between the old and new equilibrium prices? 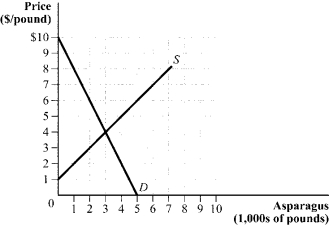
Correct Answer:
Verified
View Answer
Unlock this answer now
Get Access to more Verified Answers free of charge
Q84: The demand and supply curves for a
Q86: Suppose that watermelon, with price PW, and
Q89: In the standard model, we expect the
Q90: Suppose the inverse demand for a good
Q91: Suppose that the extended market demand curve
Q92: Suppose that the extended supply curve for
Q93: Answer the following questions about price elasticity
Q94: Suppose that the market demand curve for
Q120: The inverse supply equation for clay pots
Q137: Suppose that the market demand and supply
Unlock this Answer For Free Now!
View this answer and more for free by performing one of the following actions

Scan the QR code to install the App and get 2 free unlocks

Unlock quizzes for free by uploading documents