The figure below shows a family of cost curves for a firm. The subscripts 1, 2, and 3 for the SRATC curves refer to different plant sizes. 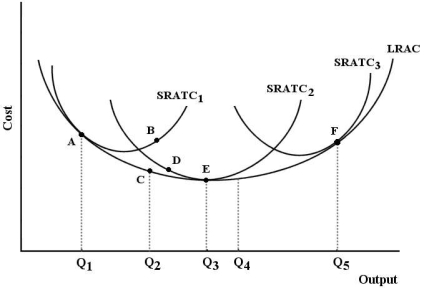 FIGURE 8-3
-Refer to Figure 8-3. Should this firm ever consider moving from point E (output level Q₃ onSRATC2) to point F (output level Q5 on SRATC3) ?
A) Yes, because the firm can take advantage of economies of scale.
B) Yes, if the product price rises enough to lead the firm to expand to plant size 3.
C) No, because they are already producing at their lowest possible cost at point E.
D) No, because producing at point F implies a higher cost per unit of output.
E) Yes, because SRATC3 is the optimal plant size for this firm.
Correct Answer:
Verified
Q2: Suppose that capital costs $8 per unit
Q4: Canada has a much lower population density
Q5: "The bigger the volume, the lower the
Q7: In the long run, the law of
Q8: Which of the following is unlikely to
Q10: If a firm is using labour and
Q15: Increasing returns to scale for a firm
Q20: A change in the technique for producing
Q34: Suppose that capital costs $50 per unit
Q36: The slope of a firm's isocost line
Unlock this Answer For Free Now!
View this answer and more for free by performing one of the following actions

Scan the QR code to install the App and get 2 free unlocks

Unlock quizzes for free by uploading documents