The figure below shows a family of cost curves for a firm. The subscripts 1, 2, and 3 for the SRATC curves refer to different plant sizes. 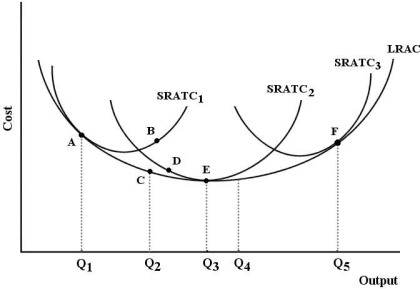 FIGURE 8- 3
-Refer to Figure 8- 3. If this firm is producing at point B, then
A) this firm is producing a level of output that is technically inefficient in the long run.
B) this firm could produce the same level of output at a lower cost with plant size 2.
C) it should employ more of its variable factors of production.
D) this firm is experiencing decreasing returns to scale.
E) plant size 1 is optimal.
Correct Answer:
Verified
Q63: The slope of an isoquant measures
A) the
Q64: By expressing the cost- minimizing condition as
Q65: If there is an improvement in the
Q66: Which of the following conditions indicate cost
Q67: Suppose that capital costs $10 per unit
Q69: Suppose a firm employs two kinds of
Q70: A firm trying to maximize its profits
Unlock this Answer For Free Now!
View this answer and more for free by performing one of the following actions

Scan the QR code to install the App and get 2 free unlocks

Unlock quizzes for free by uploading documents