The figure below shows the isocost lines and the isoquant map for a firm producing golf tees. 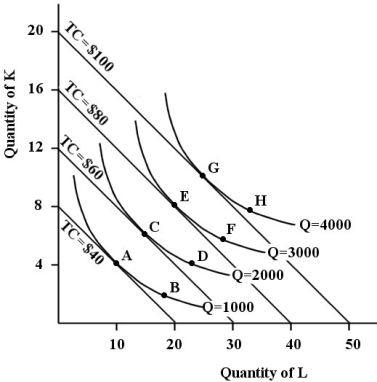 FIGURE 8-6
-Refer to Figure 8-6. As this firm is increasing its production of golf tees, it is experiencingreturns to scale.
A) not determinable from the information provided
B) constant
C) decreasing
D) diminishing
E) increasing
Correct Answer:
Verified
Q61: The figure below shows a family of
Q63: The slope of an isoquant measures
A) the
Q66: Which of the following conditions indicate cost
Q67: Suppose that capital costs $10 per unit
Q70: A firm trying to maximize its profits
Q72: Isocost lines are downward sloping straight lines,
Q74: Any point representing a cost and output
Q75: A very- long- run consideration that could
Q79: The figure below shows the isocost lines
Q109: The figure below shows the isocost lines
Unlock this Answer For Free Now!
View this answer and more for free by performing one of the following actions

Scan the QR code to install the App and get 2 free unlocks

Unlock quizzes for free by uploading documents