The figure below shows a family of cost curves for a firm. The subscripts 1, 2, and 3 for the SRATC curves refer to different plant sizes. 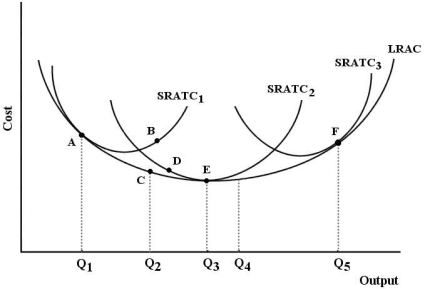 FIGURE 8-3
-Refer to Figure 8-3. Suppose this firm is producing output level Q₃ with plant size 2. Now suppose this firm changes to plant size 3 and is producing output level Q5. We can say that
A) output has increased exactly in proportion to the increase in inputs.
B) output has increased less than in proportion to the increase in inputs.
C) output has increased more than in proportion to the increase in inputs.
D) this firm has experienced economies of scale.
E) the firm is then operating with the optimal plant size.
Correct Answer:
Verified
Q36: Suppose that capital costs $10 per unit
Q75: Q82: Canada has a much lower population density Q88: The figure below shows the isocost lines Q91: With respect to innovation, which of the Q92: Assume a firm is using 10 units Q94: Which of the following statements concerning long- Q103: The figure below shows the isocost lines Q104: The following table shows the marginal Q110: ![]()
![]()
Unlock this Answer For Free Now!
View this answer and more for free by performing one of the following actions

Scan the QR code to install the App and get 2 free unlocks

Unlock quizzes for free by uploading documents