The figure below shows the isocost lines and the isoquant map for a firm producing golf tees. 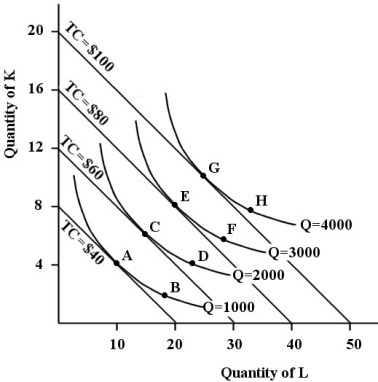 FIGURE 8- 6
-Refer to Figure 8- 6. Suppose there is a change in relative factor prices and the cost- minimizing method of producing 2000 golf tees is now at point D. If the total cost of producing 2000 golf tees is still $60, it must be the case that
A) the price of labour rose and the price of capital fell.
B) the price of labour fell and the price of capital remained constant.
C) the price of labour and capital both fell.
D) the price of labour fell and the price of capital rose.
E) the price of labour and capital both rose.
Correct Answer:
Verified
Q36: Suppose that capital costs $10 per unit
Q51: The following table shows the marginal products
Q83: Although capital is a variable factor in
Q84: Which of the following paired concepts are
Q85: In defining a firm's long- run average
Unlock this Answer For Free Now!
View this answer and more for free by performing one of the following actions

Scan the QR code to install the App and get 2 free unlocks

Unlock quizzes for free by uploading documents