The figure below shows the isocost lines and the isoquant map for a firm producing golf tees. 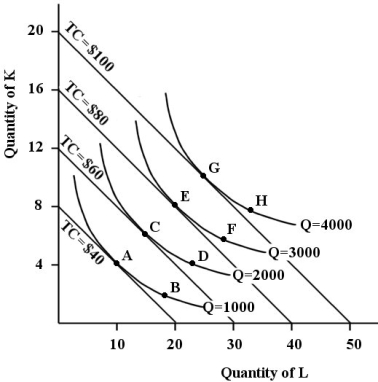 FIGURE 8- 6
-Refer to Figure 8- 6. Suppose this firm is producing 3000 golf tees and is at point F on the isoquant map. In order to maintain its output and minimize costs this firm should
A) not change its use of factors.
B) employ more capital and less labour.
C) employ more labour and less capital.
D) move to an isocost line further from the origin.
E) move to an isoquant closer to the origin.
Correct Answer:
Verified
Q100: Consider a firm that uses only labour
Q101: The fact that isoquants are downward sloping
Q102: The figure below shows the isocost lines
Q103: The figure below shows the isocost lines
Q104: The following table shows the marginal
Q105: Assume a firm is using 10 units
Q106: The figure below shows the isocost lines
Q108: The table below shows the number
Q110: Q119: ![]()
![]()
Unlock this Answer For Free Now!
View this answer and more for free by performing one of the following actions

Scan the QR code to install the App and get 2 free unlocks

Unlock quizzes for free by uploading documents