The diagram below shows the market for litres of milk.
FIGURE 5-8
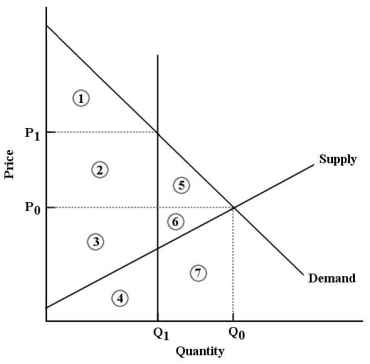
-Refer to Figure 5-8. Suppose that a binding output quota is imposed on this market at quantity Q₁.The loss in economic surplus due to the quota is equal to
A) areas 5 and 6.
B) areas 2 and 5.
C) areas 5, 6 and 7.
D) areas 1, 2 and 3.
E) area 1.
Correct Answer:
Verified
Q35: The diagram below shows the market for
Q62: Suppose a binding output quota is imposed
Q71: Q73: Consider Canada's east coast lobster fishery. Suppose Q74: The short- run supply for housing is Q76: In competitive markets, price floors and price Q77: Partial- equilibrium analysis considers Q78: The diagram below shows the market for Q79: In general (and in the absence of Q93: The shortage of housing that exists in![]()
A) all markets simultaneously,
Unlock this Answer For Free Now!
View this answer and more for free by performing one of the following actions

Scan the QR code to install the App and get 2 free unlocks

Unlock quizzes for free by uploading documents