Multiple Choice
The diagram below shows the market for litres of milk.
FIGURE 5-8
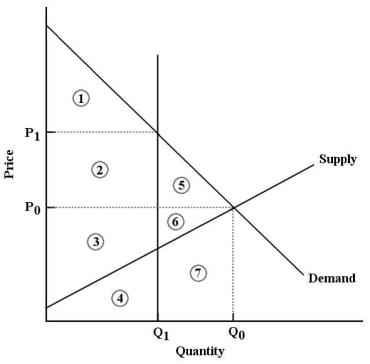
-Refer to Figure 5-8. After the imposition of a milk quota at quantity Q₁, economic surplus is represented by
A) areas 3 and 4.
B) areas 1, 2 and 3.
C) areas 2, 3, 5 and 6.
D) areas 1, 2 and 5.
E) areas 1, 2, 3, 4, 5, 6 and 7.
Correct Answer:
Verified
Related Questions
Q24: Suppose that the free-market equilibrium price of
Q41: A legal price ceiling, if it is
Q53: Geoff is willing to pay $13 for
Unlock this Answer For Free Now!
View this answer and more for free by performing one of the following actions

Scan the QR code to install the App and get 2 free unlocks

Unlock quizzes for free by uploading documents